
- Flexera Community
- :
- App Broker
- :
- App Broker Forum
- :
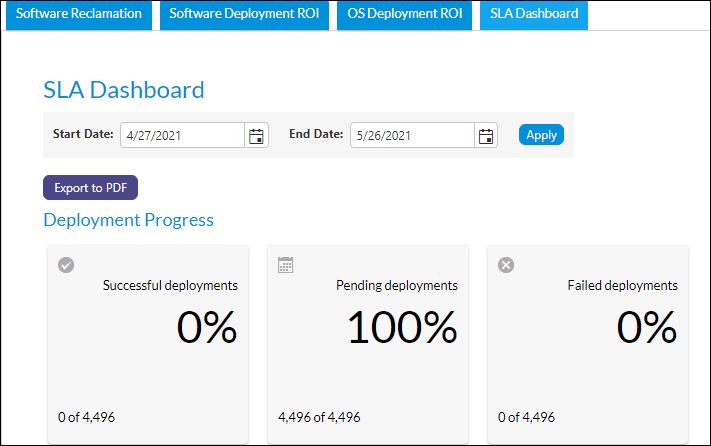
- SLA Dashboard All Request showing Pending Deployement.
- Subscribe to RSS Feed
- Mark Topic as New
- Mark Topic as Read
- Float this Topic for Current User
- Subscribe
- Mute
- Printer Friendly Page
SLA Dashboard All Request showing Pending Deployement.
- Mark as New
- Subscribe
- Mute
- Subscribe to RSS Feed
- Permalink
- Report Inappropriate Content
- Mark as New
- Subscribe
- Mute
- Subscribe to RSS Feed
- Permalink
- Report Inappropriate Content
- Mark as New
- Subscribe
- Mute
- Subscribe to RSS Feed
- Permalink
- Report Inappropriate Content
- Mark as New
- Subscribe
- Mute
- Subscribe to RSS Feed
- Permalink
- Report Inappropriate Content
I can not boil down the dashboard to a single query, as there is quite a bit of logic in the SLA Dashboard page, but I can summarize where the SLA dashboard numbers are coming from with a few queries. The first query gives the total number of requests being processed for deployment progress... The Second query gives the number of successful requests, and the third gives the failed requests. The number of pending requests are calculated based on (total - (success + failure)
--Total requests query (note that the date range changes):
Select Count(*) FROM ( select distinct pr.* from WD_PackageRequests pr join WD_WebPackages wp on pr.PackageID_FK=wp.PackageID join WD_Package_Deployment pd on wp.PackageID=pd.PackageID_FK AND pr.DeploymentTechnology=pd.DeploymentTechnology where pr.inserted=1 and pr.deleted<>1 and pd.PackageType not in (1,3) and PR.DateTime between '04/28/2016 00:00:00:00' and '10/09/2018 23:59:59:999' ) softwareReq
--successful deployments (note that the date range changes)
select count(distinct PR.requestID) from WD_PackageRequests pr join WD_WebPackages wp on pr.PackageID_FK=wp.PackageID join WD_Package_Deployment pd on wp.PackageID=pd.PackageID_FK AND pr.DeploymentTechnology=pd.DeploymentTechnology where pr.inserted=1 and pr.deleted<>1 and ( (pr.LastStateID=1001 AND pd.PackageType=25) OR (pr.LastStateID=1001 AND pd.PackageType=18) OR (pr.LastStateID=1 AND pd.PackageType=15) OR (pr.LastStateID=1001 AND pd.PackageType in (19,20,21,22,23)) OR (pr.LastStateID in (13,15,17,18,19) and pd.PackageType in (0) and pd.DeploymentTechnology=2) OR (pr.LastStateID in (18,19,17,13,15) and pd.PackageType in (0) and pd.DeploymentTechnology=1) OR (pr.LastStateID in (18,19,17,13,106,100,15) and pd.PackageType in (0) and pd.DeploymentTechnology=8) OR(pr.LastStateID=13 and LastStatusID=11171 and pd.PackageType=4) ) and PR.DateTime between '04/28/2016 00:00:00:00' and '10/09/2018 23:59:59:999'
--failed deployments ((note that the date range changes)
select count(distinct PR.requestID) from WD_PackageRequests pr join WD_WebPackages wp on pr.PackageID_FK=wp.PackageID join WD_Package_Deployment pd on wp.PackageID=pd.PackageID_FK AND pr.DeploymentTechnology=pd.DeploymentTechnology where pr.inserted=1 and pr.deleted<>1 and ( (pr.LastStateID=1002 AND pd.PackageType=25) OR (pr.LastStateID=1002 AND pd.PackageType=18) OR (pr.LastStateID=5 AND pd.PackageType=15) OR (pr.LastStateID=1002 AND pd.PackageType in (19,20,21,22,23)) OR (pr.LastStateID in (101,11,230) and pd.PackageType in (0) and pd.DeploymentTechnology=2) OR (pr.LastStateID in (101,11) and pd.PackageType in (0) and pd.DeploymentTechnology=1) OR (pr.LastStateID in (101,11,230) and pd.PackageType in (0) and pd.DeploymentTechnology=8) OR(pr.LastStateID=11 and LastStatusID=11170 and pd.PackageType=4) ) and PR.DateTime between '04/28/2016 00:00:00:00' and '10/09/2018 23:59:59:999'
Note that rejected and canceled requests, those awaiting approval, and those requests which have not yet been inserted are not included in the totals. Obviously, the date range in the above queries would need to be changed to reflect the data range entered on the SLA dashboard.
One other thing to note: The queries I provided may result in slightly different results in your environment, as you may have changed the status mappings from their defaults. For example, in the failed query, you will see "pr.LastStateID in (101,11,230) and pd.PackageType in (0)". The in clause values of "101,11,230" are getting pulled from the setting FailureStatusIDs_ConfigMgr in wd_appsettings (which can be set under settings->deployment->config Mgr).
I can only assume that based on the results, you may be modifying your DB manually in some way, and are neglecting to set the LastStatusID or LastStateID columns correctly.
May 26, 2021 01:08 PM
- Mark as New
- Subscribe
- Mute
- Subscribe to RSS Feed
- Permalink
- Report Inappropriate Content
- Mark as New
- Subscribe
- Mute
- Subscribe to RSS Feed
- Permalink
- Report Inappropriate Content
How to resolve this issue?
May 27, 2021 08:10 AM
- Mark as New
- Subscribe
- Mute
- Subscribe to RSS Feed
- Permalink
- Report Inappropriate Content
- Mark as New
- Subscribe
- Mute
- Subscribe to RSS Feed
- Permalink
- Report Inappropriate Content
If the information Charles has provided doesn't help you investigate this further, I would suggest opening a support case and working with Charles (or another engineer) directly.
May 27, 2021 10:18 AM
- Mark as New
- Subscribe
- Mute
- Subscribe to RSS Feed
- Permalink
- Report Inappropriate Content
- Mark as New
- Subscribe
- Mute
- Subscribe to RSS Feed
- Permalink
- Report Inappropriate Content
First, you can tell me if you are, or have been, updating the WD_packageRequests table by running queries against the App Portal DB? If so, then it is likely that you are doing so incorrectly. As mentioned, I'd guess that it would likely be that the lastStateID or LastStatusID columns are not set correctly. The queries I provided previously show you generally what values App Broker is expecting to either flag a request as successful or failed...
I see that you now have two separate support cases open, which appear to pertain to the SLA dashboard so let's try to keep this discussion going either through a single support case or the community post, to avoid duplication of efforts.
Jun 02, 2021 09:24 AM
- Mark as New
- Subscribe
- Mute
- Subscribe to RSS Feed
- Permalink
- Report Inappropriate Content
- Mark as New
- Subscribe
- Mute
- Subscribe to RSS Feed
- Permalink
- Report Inappropriate Content
Jun 03, 2021 12:58 AM
- Mark as New
- Subscribe
- Mute
- Subscribe to RSS Feed
- Permalink
- Report Inappropriate Content
- Mark as New
- Subscribe
- Mute
- Subscribe to RSS Feed
- Permalink
- Report Inappropriate Content
HI, @CharlesW we are not updating anything in the database manually.
Jun 03, 2021 04:01 AM
- Mark as New
- Subscribe
- Mute
- Subscribe to RSS Feed
- Permalink
- Report Inappropriate Content
- Mark as New
- Subscribe
- Mute
- Subscribe to RSS Feed
- Permalink
- Report Inappropriate Content
OK, thanks for the update.. I'm working with the support case owners to see if we can get this resolved.. It looks like the status update in the App Portal DB is not occurring correctly, due to some problem with requestID 94344. Steps will be provided shortly which will hopefully resolve the issue.. I'll continue to work with the case owners until this gets resolved.. Note that the SLA dashboard showing all pending requests appears to be a side effect of the bigger problem, which would occur if the status is not getting updated in the DB.
Jun 03, 2021 08:59 AM
