A new Flexera Community experience is coming on November 25th. Click here for more information.

- Flexera Community
- :
- Software Vulnerability Management
- :
- Software Vulnerability Management Blog
- :
- SVM Historical Reporting with PowerBI
- Subscribe to RSS Feed
- Mark as New
- Mark as Read
- Subscribe
- Printer Friendly Page
- Report Inappropriate Content
- Subscribe to RSS Feed
- Mark as New
- Mark as Read
- Subscribe
- Printer Friendly Page
- Report Inappropriate Content
A common question that is seen among the IT Operations and Security teams is – "How am I doing with the security vulnerabilities in my environment?" or put differently, "what is the trend of vulnerable applications and/or devices in my environment? Is it going upwards or downwards? Am I getting better at addressing software vulnerabilities?"
We have heard interest in being able to answer questions like these customers, who were very keen in having a capability to build their own trend reports beyond the reports available in SVM. To help address this need, we have made some improvements to the APIs that gather such data and are leveraging these using the tool described as part of the SVM Client Toolkit.
This new tool was released as part of our June 2021 update of SVM. Upon installing the new version of SVM Client Toolkit, a shortcut will be created on the desktop which allows you to pull data from SVM and store it on your local SQL server. It provides an option to establish a connection to a local SQL Server and to SVM.
These steps are shown in an attached video, but the steps are pretty straight forward: When connecting to a SQL Server for the first time, select the option to create a database. The tool will create a database on the SQL Server with the required schema to store data from SVM. Upon successful connection to SQL Server and creating a database, click ‘Sync Data’ to collect SVM data for this point in time The first time you do so, the sync may take few minutes, depending on how many hosts and applications you may have in your environment. You may then choose to schedule future data syncs. To support this, the tool supports a command line switch that may be leveraged along with the Windows Task Sequencer to automatically run all the future data syncs at your desired frequency.
We also provide four Power BI templates for trend reporting as a strong starting point, which you may choose to customize to your specific needs. With PowerBI Desktop installed, you may import the provided templates and change the database connection to your local database where you synced SVM data. The four provided Power BI templates represent the following sample trend reports:
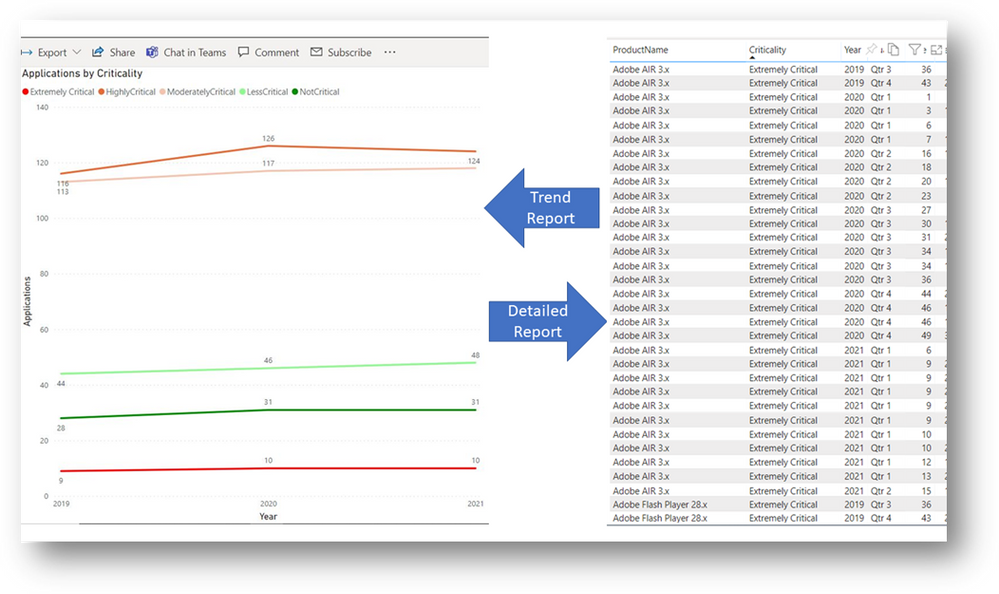
- Applications by Criticality: Displays the trend representing the unique number of applications by their criticality (Extreme Critical, Highly Critical, Moderately Critical, Less Critical and Not Critical) .
- Applications by Status: Displays the trend representing the unique number of applications by their status (Secure, Insecure and End of Life).
- Devices by Criticality: Displays the trend representing the unique number of devices by their criticality. If a vulnerable application is found on a device, then the device will be categorized under that application’s criticality level, for example if an Extremely Critical application is found on a device, then that device will be categorized as Extremely Critical.
- Devices by System Score: Displays the trend representing unique devices by their system score. System Score represents the percentage of secure vs insecure applications on a device. In this report we have color-coded the values to show red is for system score less than 80%, yellow for system score between 80% and 95%, and green for system score above 95%.
Each report has a line graph on the left showing the trend and a detailed tabular report on the right. For instance: in the Applications by Criticality report, the line graph on the left shows the trend of of unique applications by their criticality across years, months, weeks, and days and the detailed report on the right shows a table with the list of all the applications. Therefore, by way of example, if Adobe AIR 3.x appears as an Extremely Critical application 4 times each in Q1, Q2 and Q4 and 5 times in Q3 for the year 2020, this would be a total of 17 occurrences for the year 2020. In the line graph Adobe AIR 3.x will be counted only once (unique) for year 2020. Similarly, it will be counted only once for each of the four quarters at the quarter level. The detailed report in the table shows all the 17 occurrences along with the quarter, week, and day on which this app was found in a scan. If you’d like to work with such data outside of PowerBI, the tabular report can be exported into an excel document if you wish you see each occurrence of an application and build your own report there.
Attached here is a video demonstrates how to use the new tool to connect to SVM and a SQL Server and pull data from SVM into SQL Server database. The video also shows how to import the in-built Power BI templates and generate a trend report.
This is a starting point, and one that we intend to enhance with your feedback. Based on your input, we can extend our APIs to collect additional data and this tool to make use of them. Please leverage our Ideas portal to make specific requests for data and when possible state the purpose of the report and how you intend to action it.
- SVM July Update in Software Vulnerability Management Release Blog
- SVM June Update in Software Vulnerability Management Release Blog
- Monthly Vulnerability Review: October 2019 in Software Vulnerability Management Blog
- Third Party Thursday: Focus on what matters and patch in Software Vulnerability Management Blog

