- Revenera Community
- :
- Usage Intelligence
- :
- Usage Intelligence Forum
- :
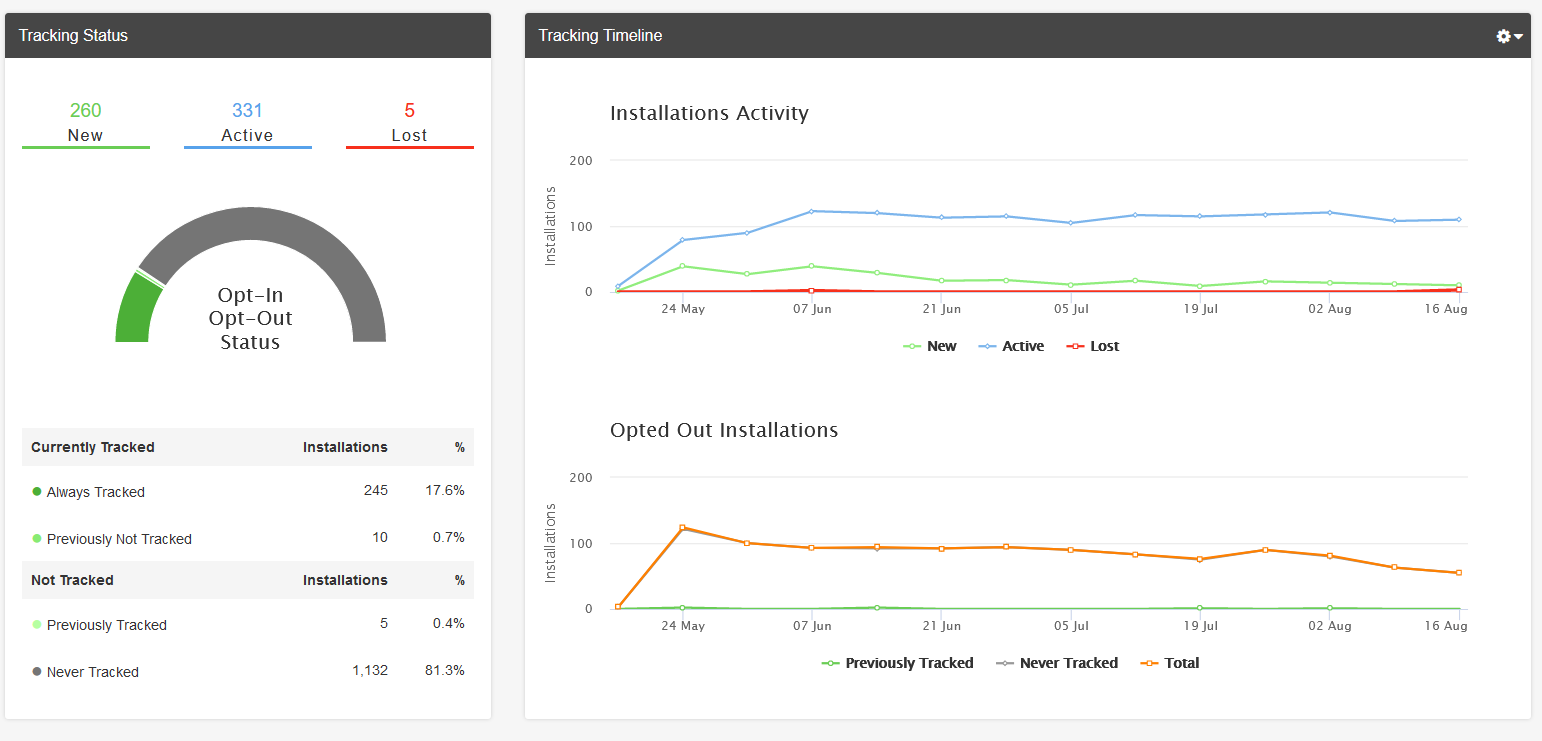
- Tracking Status
- Mark Topic as New
- Mark Topic as Read
- Float this Topic for Current User
- Subscribe
- Mute
- Printer Friendly Page
- Mark as New
- Subscribe
- Mute
- Permalink
- Report Inappropriate Content
Hi,
i would like to know how the number Active, displayed in the dashboard under Installation Activity is calculated.
And how does this number correspond with Always Tracked, Previously Not Tracked,...?
Summing up all number i can not get to the number displayed for Active.
Thanks in advance
Hannes
- Mark as New
- Subscribe
- Mute
- Permalink
- Report Inappropriate Content
Hi Hannesc,
Thanks for the query.
Active means a (non-opted-out) client that is tracked within the specified date range.
A new installation is also an active installation – so it can be said that “new” is a subset of “active”. Also, a subset of “lost” users may also be “active”. ”. That is because if you select a date range from January to March, an installation could be active in January, but then stopped using and got declared as lost in March.
Always tracked, previously not tracked, etc. refer to the opt-out mechanism... always tracked means installations that are not opted-out, previously not tracked are installations that are currently being tracked but at a point in the past they were opted out, etc.
The numbers Always Tracked, Previously Not Tracked cannot be summed up always, as there is also a dependency on date range selected for the report and data available with us on the day of checking the report.
- Mark as New
- Subscribe
- Mute
- Permalink
- Report Inappropriate Content
Hi,
i would like to know how the curve under Installation Activity can be interpreted.
Installation Acitivity
We interpret the curve, that it shows the New, Active and Lost users (=unique id's)
It's not possible to sum up the values to get to the number of Active, New, Lost Displayed in the Tracking Status.
Opted Out Installations
We assume that this curve shows the number of users opted out during the set time (at that day, in that week, in that month).
The numbers can be added and should correspond to the number displayed for Never tracked under Tracking Status.
The curve does not display the amount of users which use the software during that time but are opted-out.
Is this assumption correct. Or how do we have to interpret these curves?
And how can we find more info about the dashboard and the data? Is it documented, and where?
Thanks in advance
Hannes
- Mark as New
- Subscribe
- Mute
- Permalink
- Report Inappropriate Content
Please note that the Opt-Out installations are always calculated on New Installations and not on Active installations because of many reasons, like-
-Active users will always fall under currently being tracked, but will never have count of /fall under currently not being tracked
-When a user installs application first time and immediately chooses to not being tracked, they will never be counted under active installations
The Calculation of New installations broken down on Opted-out chart goes as this:
New Installations = Always Tracked + Previously Not Tracked + Previously Tracked
Tracking Status report and Tracking Timeline display data based on the date range selected. However the Tracking Timeline report further can be re-presented using Daily/Weekly/Monthly selection.
The two charts can still be compared for New/Active/Lost counts: e.g. If for a given date range count of Active installation is 1000 on Tracking status chart, then all the data points for Active installations on Installation activity (whether day/week/month) should sum up to 1000. (This can be easily verified, by selecting a month date range and chose display frequency as Month for Installation Activity chart).
Your assumptions for Opted Out Installations are right.
- Mark as New
- Subscribe
- Mute
- Permalink
- Report Inappropriate Content
Hi,
i have another question concerning the Active Installations.
A user who installs two versions of our product on the same machine, he gets the same unique user id. (At least, he get's no new unique user id by us)
For example Version10 and the newer Version11.
If the user now uses starts Version10 and closes this, than starts Version11 and closes this, afterwards starts again Version10 and closes this.
The Versions Distribution (which we use to collect the used version) changes.
But does the system track this as a New Installation, a Lost Installation,...
And also as two Active Installation, or more?
Sorry i know this is a little bit confusing, but i am confused about the number displayed under active installations.
And this does also confuse me.
New Installations = Always Tracked + Previously Not Tracked + Previously Tracked
In special the bold one.
New Installations = Always Tracked + Previously Not Tracked + Previously Tracked
Beside this is it possible to get a paper where the dashboard and the tracked data is explained in detail?
Kind regards
Hannes
- Mark as New
- Subscribe
- Mute
- Permalink
- Report Inappropriate Content
Hi Hannes,
Apologies for the delayed response.
The number of activations for version10 and version11 always depends on the configured log path used in the CreateConfig API. If the application supports multiple user profiles and each user needs to be tracked separately, then a unique folder must be created for every user when calling the CreateConfig method. Using independent folders allows the SDK to generate a unique fingerprint for every user and track them as independent installations.
Please refer to the following links for more details:
2) https://docs.revenera.com/ui551/bp/441_BestPracticesGuide_v4.pdf (Tracking Multiple User Profiles Per Installation).
Installation Activity:
==================
This report provides an overview of the tracking status of your install base, including the ratio of opted-in vs opted-out users. For opt-out statistics to be collected you must be running SDK Ver 5.1 or later and inform the SDK by calling ruiOptOut() when a user opts out.
Tracking Status shows the number of new, active and lost installations for the selected date range. The new installation count is further split into how many installations were:
Always Tracked: always opted-in
Previously Not Tracked: started opted-out but are now opted-in
Previously Tracked: started opted-in but are currently opted-out
The opt-out statistics also show the number of new installations that were Never Tracked. These installations have been opted-out since their first call-home and thus no data has ever been collected from such clients. They will not show up as New installations and are never included in any other Usage Intelligence reports.
Tracking Timeline shows the status of your install base over time. The Opted Out Installations timeline shows when the opted-out users sent the opt-out signal to stop being tracked.
Please let us know if you need any other details.
Thanks,
Sathish