A new Flexera Community experience is coming on November 25th. Click here for more information.

- Flexera Community
- :
- Flexera One
- :
- Flexera One Blog
- :
- Creating Cloud Cost Dashboards for specific use cases
- Subscribe to RSS Feed
- Mark as New
- Mark as Read
- Subscribe
- Printer Friendly Page
- Report Inappropriate Content
- Subscribe to RSS Feed
- Mark as New
- Mark as Read
- Subscribe
- Printer Friendly Page
- Report Inappropriate Content
Flexera has made an improvement to the Cloud Cost Optimization Dashboards to enhance the dashboard experience for users. Dashboard designers can now create a dashboard to meet specific use cases, such as reporting on S3 Storage Cost for a specific account or business context i.e. department, cost center, application.
When creating dashboards, you may wish to build a dashboard to meet a specific use case (i.e. Reporting on S3 storage, with certain clouds or accounts only) that you can share with others within the organization. They may also wish to further filter these dashboards based on their own requirements, i.e. for a specific cost center, department, or application.
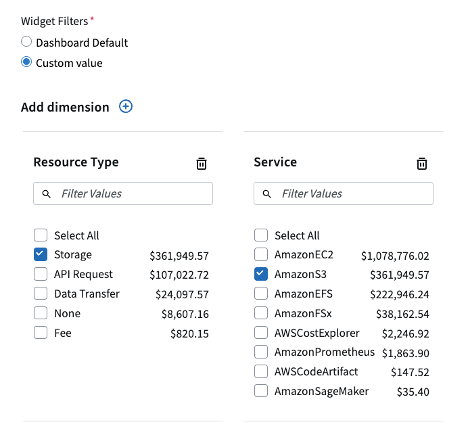
As an example, this dashboard is showing Costs of AWS Storage types for S3, and the filter widget is PRE-FILTERED to show only this data, allowing a user to add additional filters, say for region, cloud account or whatever their specific context may be.
To achieve this, edit the filter widget and set the Widget filters to achieve the outcome you wish to pre-filter for – in this case we’ve selected Service=Amazon S3 and Usage type=Storage to get the desired outcome.
Filter Widget Changes
- Provide default filters options to be applied to other widgets on the dashboard. These are configured in the Widget settings and users cannot change these settings.
- Provide default user selectable dimensions. These can be any dimension where users can select the desired value, such as their team, line of business, cost center or application.
How to use:
- Add the Filter widget to the dashboard.
- Use the Widget Filter settings to configure your dashboard default options. i.e. cloud and service
- Select the Dimension you would like users to select from to add the context desired for the report. This can be any of the dimensions include business context such as Tags or Rule Based Dimension(s)
- Add or updated your other Dashboard widgets (Bar Charts, Tables, Single Total)
- Use the Widget Filter settings to Link to the Filter widget you created above.
- Save the Layout
See the demo how to create similar dashboards with the new Widget Filter settings.
- Cloud Cost Optimization and Automation: Saving User Settings in Flexera One Blog
- New allocation rules for SaaS license purchases in Flexera One Blog
- FlerxeraOne Dashboards in Flexera One Forum
- Create a new analytics report and add a custom widget in Flexera One Knowledge Base
- Dashboard Tutorials in Flexera One Forum


