- Revenera Community
- :
- Usage Intelligence
- :
- Usage Intelligence Knowledge Base
- :
- Custom Numeric Event Tracking Reporting
- Mark as New
- Mark as Read
- Subscribe
- Printer Friendly Page
- Report Inappropriate Content
Custom Numeric Event Tracking Reporting
Custom Numeric Event Tracking Reporting
Usage Intelligence now offers a new Custom Event Tracking report. If you choose to track an event with numeric data in your application, you will now be able to generate a custom report on that event.
Enabling Custom Numeric Event Tracking In Your Application
Depending on the SDK used to integrate with Usage Intelligence, refer the corresponding document for instructions for Logging a Custom Event as name/value string pairs:
- C++ for Windows SDK
- C++ for macOS SDK
- C++ for Linux SDK
- Objective-C for macOS SDK
- Java SDK
- .NET SDK
- .NET Multiplatform SDK
Viewing Custom Events
Custom events (sent / pushed / logged) will be visible on the Recent Custom Events tab of the Features & Event Tracking > Custom Event Tracking page in the format as shown below.
Example: ReportLoad Report
The following is an example of creating a Custom Events Report for an event named ReportLoad.
Requirements
To generate this report, the following items must be true:
- For example, suppose you have an event with a category of ApplicationRuntime and an event name of ReportLoad.
- That event has data such as file size, duration and CPU usage to report.
- Format the name in a name/value string pair, such as File_Size_KB, as shown below:
- A unit should be mentioned at the end of the name such as KB, ms, or %, preceded by an underline "_". If there is no unit, use “none” at the end. Here are examples of custom event names:
- File_Size_KB visible in report as File Size (KB).
- Duration_ms visible in report as Duration (ms).
- CPU_Usage_% visible in report as CPU Usage (%).
- Prediction_none visible in report as Prediction.
- Values are considered only if they are numeric; everything else is ignored.
NOTE: In SDK API code, values are sent as strings, but the value represented as string should be numeric.
- Numeric values should be greater than or equal to 1.
- A unit should be mentioned at the end of the name such as KB, ms, or %, preceded by an underline "_". If there is no unit, use “none” at the end. Here are examples of custom event names:
Code Snippet Example to Send Custom Numeric Events
The following is an example code snippet for the Windows C++ SDK to push an event to the Usage Intelligence platform.
bool AddDictionary(RUIINSTANCE* myInstance)
{
std::vector<RUINameValuePair> dictionary(3);
dictionary[0] = {"CPU_Usage_%", "85"};
dictionary[1] = {"File_Size_KB", "1062"};
dictionary[2] = {"Duration_ms", "7801"};
RUIRESULT rc = ruiTrackEventCustom(myInstance, "ApplicationRunTime", "ReportLoad", dictionary.data(), 3, nullptr);
return true;
}
Call AddDictionary function
Setting Up the Custom Event Tracking Report
Ensure that the event is set as Tracking on the Event Tracking Management tab of the Admin > Product page.
Once such events are sent, verify if they seem correct on the Recent Custom Events tab of the Feature & Event Tracking > Custom Event Tracking page. If required, make changes and send it again.
If the events are pushed correctly, such events will be visible on the Custom Event Tracking Management tab of the Admin > Product page. They will be in an untracked state initially. After verifying details displayed, select the Tracking checkbox for each of the events to be tracked.
After the event is set to Tracking, subsequent data sent in for that event will be collected and will be ready to be viewed in reports on the Custom Event Reporting tab of the Feature & Event Tracking > Custom Event Tracking page.
Viewing a Custom Event Tracking Report
To view a Custom Event Tracking report, perform the following steps.
To view the Custom Event Tracking report:
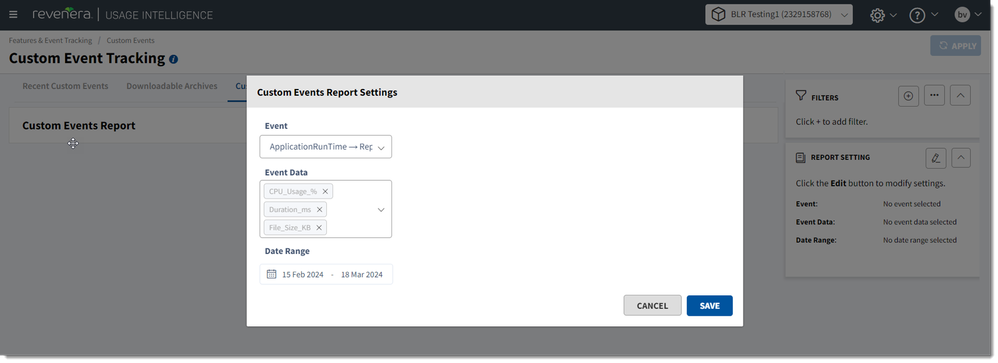
- Open the Feature & Event Tracking > Custom Events page, and select the Custom Event Reporting tab. The page opens with the Custom Events Report Settings dialog box open.
- On the Custom Events Report Settings dialog box, choose any event from the Event drop down menu.
- Choose one or more items from the Event Data menu (maximum of 10).
- Select a Date Range (within the last 90 days).
- Click Save. The Custom Events Report Settings dialog box closes.
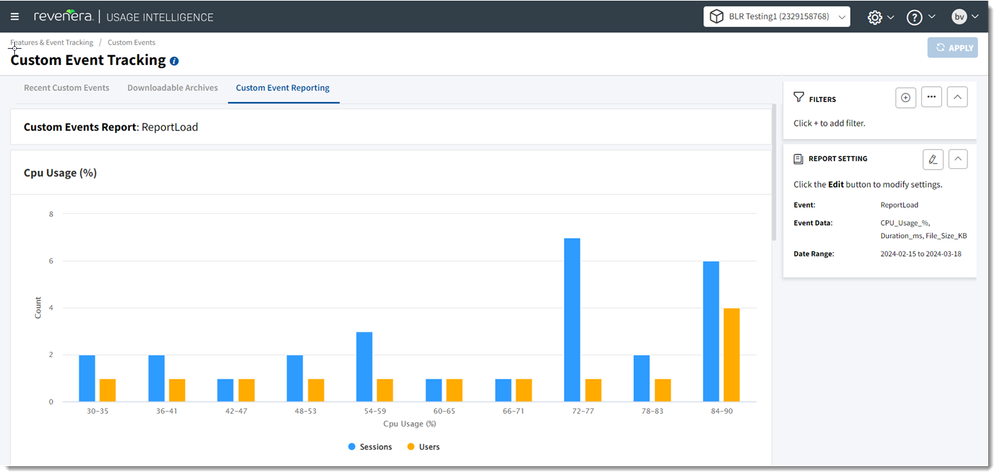
- Click Apply. The report is generated.
If there is no data to display, the report is blank.
Recommendations
Revenera recommends the following regarding Custom Numeric Event Tracking reporting:
- It is recommended to keep the raw data feature enabled for reference. You can enable raw data export by contacting Revenera Support.
- It is recommended to try this feature on your test or development accounts.
Coverage of Functionalities
Note the following regarding the range of capabilities of Custom Numeric Event Tracking reporting:
- This feature is available for all products on production which meet the requirements.
- You will be able to send custom events as name-value pairs with numeric values adhering to feature requirements documented under Requirements above.
- You will be able to track/untrack the custom events on the Custom Event Tracking Management tab of the Admin > Product page.
- You can see histogram reports for such tracked events, with specific date ranges (within the last 90 days) for selected sub data points. You can apply supported filters for the report.
- Data collected for these reports will also be available with raw data for download and a custom events archive for download.


