- Revenera Community
- :
- Code Insight
- :
- Code Insight Knowledge Base
- :
- FlexNet Code Insight v7 Integration with Splunk
- Mark as New
- Mark as Read
- Subscribe
- Printer Friendly Page
- Report Inappropriate Content
FlexNet Code Insight v7 Integration with Splunk
FlexNet Code Insight v7 Integration with Splunk
FlexNet Code Insight v7 leverages the functionality of your organization’s Splunk Enterprise by integrating Code Insight with Splunk. The Splunk Developer Program provides tools to help you connect Splunk Enterprise with your business workflows.
Splunk Components
The following Splunk components are needed to integrate FlexNet Code Insight with the Splunk Enterprise:
- Splunk Server: The Splunk Server captures, indexes, and correlates real-time Code Insight log data in a searchable repository, enabling it to then generate graphs, reports, alerts, dashboards, and visualizations. This server is available as a separate installation package, which is downloaded from the following site:
https://www.splunk.com/en_us/download/partners/splunk-enterprise.html
- Universal Forwarder—The Splunk Universal Forwarder (UF) is required to collect log data from Code Insight and forward it to the Splunk Server, where the data is then made available for searching. The UF is available as a separate installation package, which is downloaded from the following site:
https://www.splunk.com/en_us/download/universal-forwarder.html
Prerequisites
The integration of Code Insight with Splunk Enterprise has the following prerequisites:
- Currently, the integration is supported with the Splunk on-premise version only. The minimum supported version for the Splunk Server is 7.1.x.
- The UF version must be compatible with the Splunk Server version that you install. Use following link to determine compatible versions:
https://docs.splunk.com/Documentation/Forwarder/8.0.1/Forwarder/Compatibilitybetweenforwardersandindexers
Installation Notes for Installing the Splunk Components
The Splunk Server should be installed on the same instance as the FlexNet Code Insight Core Server or on an instance that has communications with the Core Server and each Scan Server. Note the following configurations:
- When the Core Server and the Scan Server are installed on the same instance, the UF needs to be installed only once on that instance.
- When the Core Server and the Scan Server are installed on separate instances, the UF must be installed separately on the instance hosting the Core Server and on the instance hosting the Scan Server.
- If multiple Scan Servers are installed, the UF must be installed on each instance hosting a Scan Server (as well as on the instance hosting the Core Server).
Overview of Splunk Solution for FlexNet Code Insight
In general, Splunk Enterprise collects, consolidates, and indexes any log or machine data, including structured, unstructured, and complex multi-line application logs. Once the data is indexed, Splunk can search, correlate, visualize, analyze, and report this data, enabling you to identify and resolve operational and security issues quickly and efficiently.
The following sections describe how Splunk functionality works with FlexNet Code Insight.
Solution Design
The following describes how Splunk Enterprise works with Code Insight:
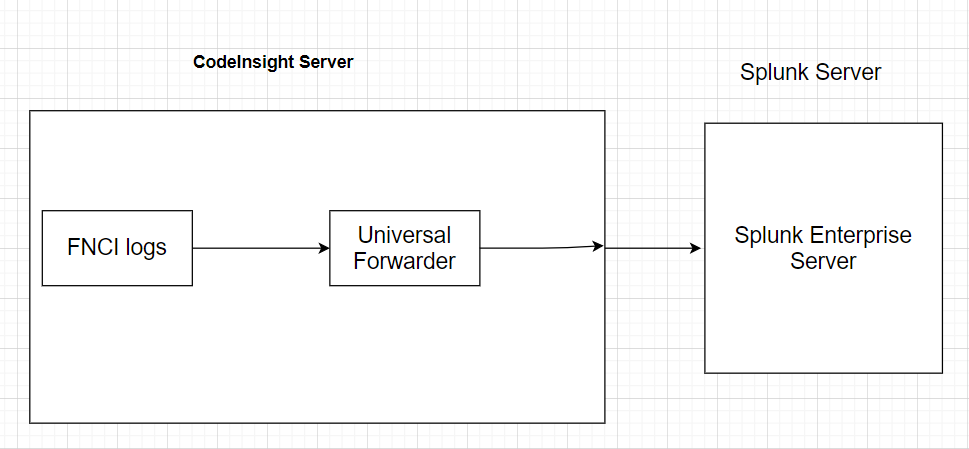
- The UF collects log data from both the Code Insight Core Server and the Scan Server. The below diagram assumes that Core Server and the Scan Server are installed on one instance. (See Installation Notes for Installing the Splunk Components for a description of the various installation scenarios.)
- The Splunk Server indexes the log data.
- Search operations are performed on this data on the Splunk Server.
About the FlexNet Code Insight Event Fields in Search Results
For your reference, the following describes the fields captured for each FlexNet Code Insight event in Splunk Enterprise. (A default field is pre-defined by Splunk and automatically captured for each event.)
- eventType—The name of the event (for example, Authentication or Authorization or a transactional action such as Scanning or PDL_Update).
- event_date_time—The time of the event, shown as a local timestamp with UTC offset.
- host–The IP, DNS, or machineName of FlexNet Code Insight instance from which the event originated. (Default field)
- outcome—The event details.
- source–The name of the file, stream, or other input from which the event originated. (Default field)
- sourcetype–The format of the data input from which the event originated. For more information, see More About the Splunk Source Types for FlexNet Code Insight. (Default field)
Phase 1: Configuring the Splunk Server to Receive Code Insight Data
This section describes how to configure the Splunk Server configuration to receive data from the FlexNet Code Insight servers.
Configuring the Server for Captured Log Data
Note: The following procedure describes how to configure the Splunk Server on a Linux instance. Adjust these steps appropriately for your operating system.
To configure the Splunk Server for Code Insight log data, do the following:
- Log on to the Splunk Server as root.
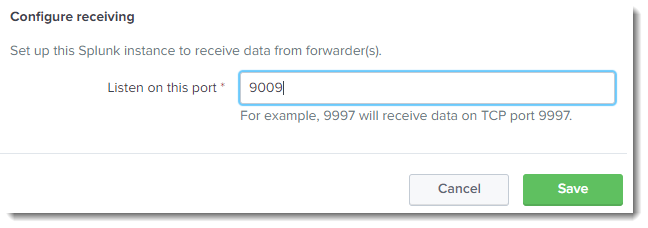
- Configure a new TCP port in Splunk Enterprise that enables the Splunk Server to receive Code Insight data from the UF. To configure the port, navigate to Settings > Forwarding and Receiving > Configure Receiving > New Receiving Port, and enter a port that is not already use. This example uses port 9009, but you can enter any available port.
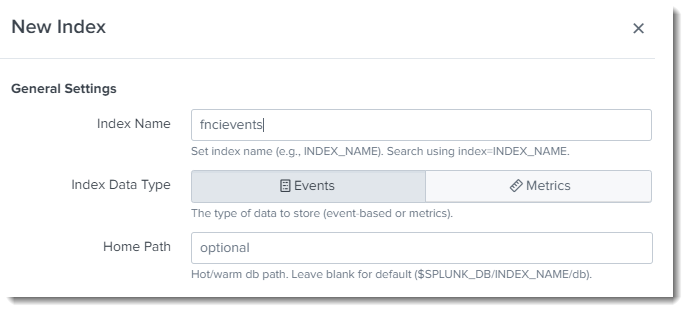
- Configure a new index in Splunk Enterprise that enables the Splunk Server to consolidate the Code Insight data it receives from the UF. To set up the index, navigate to Settings > Indexes > New Index, and enter an index name not already in use. This example uses fncievents, but you can enter any index name unique to Splunk Enterprise.
- Configure four new source types used to group the Code Insight log data in Splunk Enterprise:
- Navigate to Settings > Source Types > New Source Type.
- Create the following source types, naming them exactly as listed here: FNCICore, FNCIScanner, FNCIAPICalls, and FNCITomcatServer.
- For each source type, select Category = Application.
More About the Splunk Source Types for FlexNet Code Insight
The following are the FlexNet Code Insight log files from which data is captured for each of the source types defined in the previous section.
FNCICore
This source type captures events related to the Code Insight Electronic Updates. This data is obtained from the following log files, which reside in the ${FNCI_HOME}/logs directory on the Core Server:
- core.log
- core.update.log
- coreDetail.log
FNCIScanner
This source type captures events related to FlexNet Code Insight scan activity. The data is obtained from the following log files, which reside in the ${FNCI_HOME}/logs directory on each Scan Server. (If the Core Server and Scan Server are on the same instance, they share a single log directory.)
- scanEngineDetail.log
- scanEngineSupport.log
- codeaware.log
FNCIAPICalls
This source type captures events related to related to FlexNet Code Insight API calls. The data is obtained from the localhost_access_log_yyyy-mm-dd.txt log file, which resides in the ${FNCI_HOME}/tomcat/logs directory on the Core Server and each Scan Server. (If the Core Server and Scan Server are on the same instance, they share a single log directory.)
FNCITomcatServer
This source type captures events related to the FlexNet Code Insight Core Server and each Scan Server. This data is obtained from the following log files, which reside in the ${FNCI_HOME}/tomcat/logs directory on the Core Server and each Scan Server. (If the Core Server and Scan Server are on the same instance, they share a single log directory.)
- localhost.yyyy-mm-dd.log
- Catalina.yyyy-mm-dd.log
- host-manager.yyyy-mm-dd.log
Phase 2: Configuring the Universal Forwarder (UF) for FlexNet Code Insight
The following instructions describe how to configure the UF for integration with FlexNet Code Insight.
You must configure the UF installed on each instance hosting the Core Server or a remote Scan Server. (See Installation Notes for Installing the Splunk Components for more information.)
Information Required for the Splunk UF Configuration
You need to provide the following information when configuring the UF:
| ${FNCI_HOME} | The installation path for FlexNet Code Insight server on the given instance. |
| ${SplunkForwarder} | The installation path for the UF on the given instance. |
| ${FNCI_HOST} | The DNS or IP address for the instance on which the Code Insight server and UF are installed. By default, Splunk assigns machine name for instance. |
| ${SPLUNK_SERVER_HOST} | The DNS or IP address of the instance on which the Splunk Server is installed. |
| ${PORT} | The port enabled for the Splunk Server to receive information from the UF. (See Configuring the Server for Captured Log Data.) |
| ${SPLUNK_HOME} | The installation path for the Splunk Server. |
Configuring the Splunk UF
To configure the UF on a given instance hosting a Code Insight Core or Scan server, follow these steps:
- Configure UF to monitor the appropriate log directory. To do so, add the following content to the inputs.conf file found in the ${SplunkForwarder}/etc/apps/search/local directory. If the inputs.conf file does not exist, create it.
The following content assumes that the FlexNet Core Server and Scan Server are installed on the same instance:
[monitor:// ${FNCI_HOME }\logs\scan*.log]
disabled = false
index = fnciEvents
sourcetype = FNCIScanner
host = ${FNCI_ HOST }

[monitor:// ${FNCI_HOME }\logs\codeaware.log]
disabled = false
index = fnciEvents
sourcetype = FNCIScanner
host = ${FNCI_ HOST }

[monitor://${FNCI_HOME}\logs\core*.log]
disabled = false
index = fnciEvents
sourcetype = FNCICore
host = ${FNCI_ HOST }

[monitor://${FNCI_HOME}\tomcat\logs\*.log]
disabled = false
index = fnciEvents
sourcetype = FNCITomcatServer
host = ${FNCI_ HOST }

[monitor://${FNCIInstaller}\tomcat\logs\*.txt]
disabled = false
index = fnciSystem
sourcetype = FNCIAPICalls
host = ${FNCI_ HOST }
If you are configuring an instance that hosts the Core Server only, the inputs.conf file should contain only the entries for the Core Server and Tomcat Server logs, not entries for the scan and CodeAware logs (refer to the inputs.conf content above). The first line of each required entry is listed here. (Include the entire content for each required entry.)
[monitor://${FNCI_HOME}\logs\core*.log]
[monitor://${FNCI_HOME}\tomcat\logs\*.log]
[monitor://${FNCIInstaller}\tomcat\logs\*.txt]
If you are configuring an instance that hosts a Scan Server only, include all entries except the entry for the Core Server (refer to the inputs.conf content above). The first line of each entry that you need to include is listed here. (Include the entire content for each required entry.)
[monitor:// ${FNCI_HOME }\logs\scan*.log]
[monitor:// ${FNCI_HOME }\logs\codeaware.log]
[monitor://${FNCI_HOME}\tomcat\logs\*.log]
[monitor://${FNCIInstaller}\tomcat\logs\*.txt]
- To configure a UF connection to the Splunk Server, run the following command:
./splunk add forward-server <SPLUNK_SERVER_HOST>:<ENABLED_FORWARD_PORT>
where <SPLUNK_SERVER_HOST> is the DNS or IP address of the instance hosting the Splunk Sever, and <ENABLED_FORWARD_PORT> is receiving TCP port configured for the server.
- Restart the UF to apply the configuration changes. To do so, navigate to the ${SplunkForwarder}/bin directory, and execute the following command:
./splunk restart
Verifying Splunk Forwarder Configuration
To verify that the connection between the UF and Splunk Server is properly configured, do the following:
- Run the following command:
./splunk list forward-server
- Check the output. If the connection is properly configured, the connection to the Splunk Server is confirmed in the Active Forwards section:
Active forwards:
    <splunk_server_host>:<enabled_forward_port>
Configured but inactive forwards:
    None
Phase 3: Configuring the Splunk Server for Code Insight Event Fields
Fields like Host, SourceType, and Source are default fields (that is, log fields pre-defined by Splunk) that are automatically extracted when the UF sends data to the Splunk Server. You must configure the Splunk Server to also extract custom fields that are specific to Code Insight events.
To configure field extraction, do the following:
- Add the following content in the props.conf file found in the ${SPLUNK_HOME}/etc/system/local directory. If the props.conf file does not exist, create the file.
[FNCICore]
EXTRACT-outcome = ^(?:[^ \n]* ){4}(?P<outcome>.+)
EXTRACT-event_date_time = ^(?P<event_date_time>\d+\-\d+\-\d+\s+\d+:\d+:\d+\s+\+\d+)
EXTRACT-outcome_level = ^(?:[^ \n]* ){3}(?P<outcome_level>\w+)

[FNCIScanner]
EXTRACT-outcome = ^(?:[^ \n]* ){4}(?P<outcome>.+)
EXTRACT-event_date_time = ^(?P<event_date_time>\d+\-\d+\-\d+\s+\d+:\d+:\d+\s+\+\d+)
EXTRACT-outcome_level = ^(?:[^ \n]* ){3}(?P<outcome_level>\w+)

[FNCITomcatServer]
EXTRACT-outcome = ^(?:[^ \n]* ){3}(?P<outcome>(\[\w+(\-)?(\w+)?(\-)?(\d+)?\]\s.*))
EXTRACT-outcome_level = ^[^\.\n]*\.\d+(?P<outcome_level>[^\[]+)

[FNCIAPICalls]
EXTRACT-event_date_time = ^[^\[\n]*\[(?P<event_date_time>[^\]]+)
EXTRACT-outcome = ^[^\]\n]*\](?P<outcome>.+)
- Restart the Splunk Server to apply the configuration changes. To do so, navigate to the
${ SPLUNK_HOME }/bin/.. directory, and execute this command:
splunk restart
Phase 4: Configuring the Splunk Server for Code Insight Events
In Splunk Enterprise, log statements (that is, events) can be categorized as certain event types. For proper reporting purposes, certain FlexNet Code Insight events related to scan activity must be categorized as specific event types, which are pre-defined by Code Insight.
To configure the proper categorization of Code Insight scan events, perform this step:
- Add the following content to the eventtypes.conf file found in the ${SPLUNK_HOME}/etc/system/local directory. If the props.conf file does not exist, create the file.
[Scan]
search = Scan

[Scan_Failed]
search = Scan status: FAILED

[Scan_Success]
search = Scan status: SUCCEEDED

[pdl_update]
search = UpdateServiceImpl

[pdl_update_started]
search = Running update service as cron job.
Phase 5: Verifying the Splunk Server Configuration
To verify that the Splunk Server has been properly configured to report Code Insight events, perform these steps:
- Log into the Splunk Server as an administrator (or root user).
- Click Search & Reporting.
- In search field, enter index="fncievents", and press Enter.
If the configuration has been performed properly, FlexNet Code Insight events are displayed.
- Open Select Fields. Check that the following fields are captured for each event:
Event_date_time
Eventtype
Outcome
Outcome_level


