- Revenera Community
- :
- Usage Intelligence
- :
- Usage Intelligence Knowledge Base
- :
- How to Use the User Flow Report
- Mark as New
- Mark as Read
- Subscribe
- Printer Friendly Page
How to Use the User Flow Report
How to Use the User Flow Report
The User Flow report provides you with a picture of the journey your users take when interacting with your product. By specifying a hotspot event, you can analyze everything that happens around it, how users reach that event and which steps they take following it.
NOTE: Data for the User Flow report has been collected since February 1, 2019.
Report Settings
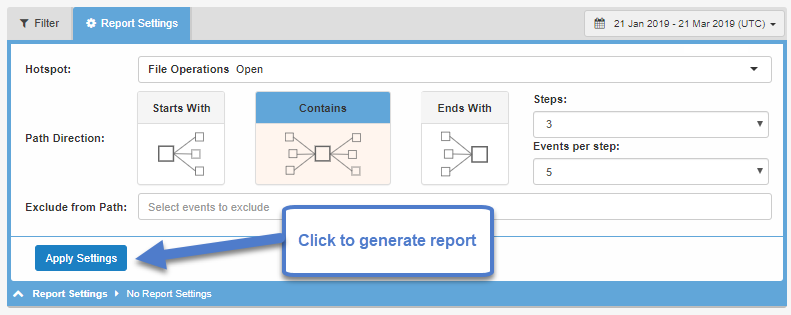
The first step to generate a User Flow report is to configure the report settings. This consists of the following choices:
- Hotspot: The key event you want to analyze. In addition to your application events you can choose from system events such as Session Start, Session Stop and Session Timeout.
- Path Direction: Choose whether the hotspot will be the starting, finishing, or center point.
- Steps: The number of steps to/from the hotspot to analyze, maximum 5 steps.
- Events per Step: The number of events to include at each step, maximum 5 events. Events which do not make it to the top events will be grouped as System: Others.
- Exclude from Path: Any events you want to exclude from the analyzed paths, this can be left empty. Events in this list will be treated as if they never occurred, so if event B is excluded a path A-B-C will be analyzed as A-C.
When ready click the Apply Settings button to generate the report and start analyzing your data.
Analyzing the Chart
Once you generate the report, you will be able to see a chart depicting the top paths that were taken by your users.
Static Mode
By default, the chart is displayed in Static Mode where links are aggregated at each step.
To view the chart in static mode:
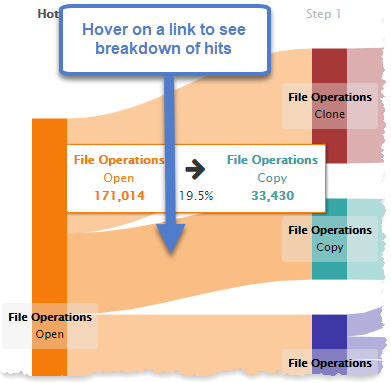
- Hover on a link to see a breakdown of the number of times users took that path.
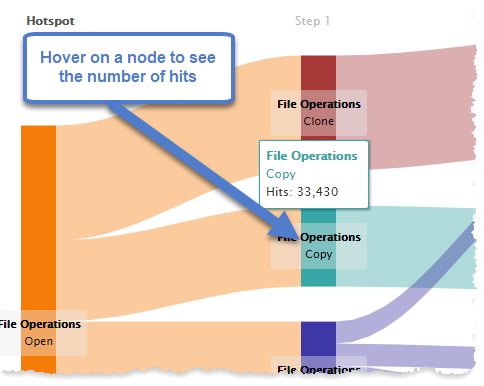
- Hover on a node to see the number of hits on an event. This value represents the number of times the event was generated at that stage of the path.
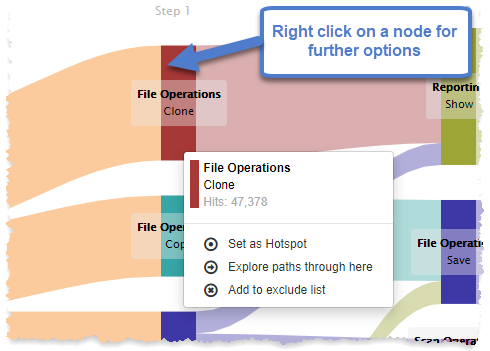
- Right click on a node for further options.
The options are:
- Set as Hotspot: Changes the hotspot to the selected event and re-generates the report
- Explore paths through here: When the path direction is Starts with or Ends with you can drill down on a specific path to analyse the paths taken following the selected node
- Add to exclude list: Adds the selected event to the exclude list, does not apply settings
Interactive Mode
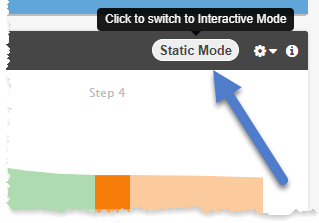
The chart can be switched to Interactive Mode to enable full path highlighting and export of individual paths to CSV.
NOTE: Switching to this mode can cause the report to slow down if the chart contains a lot of data.
To view the chart in interactive mode:
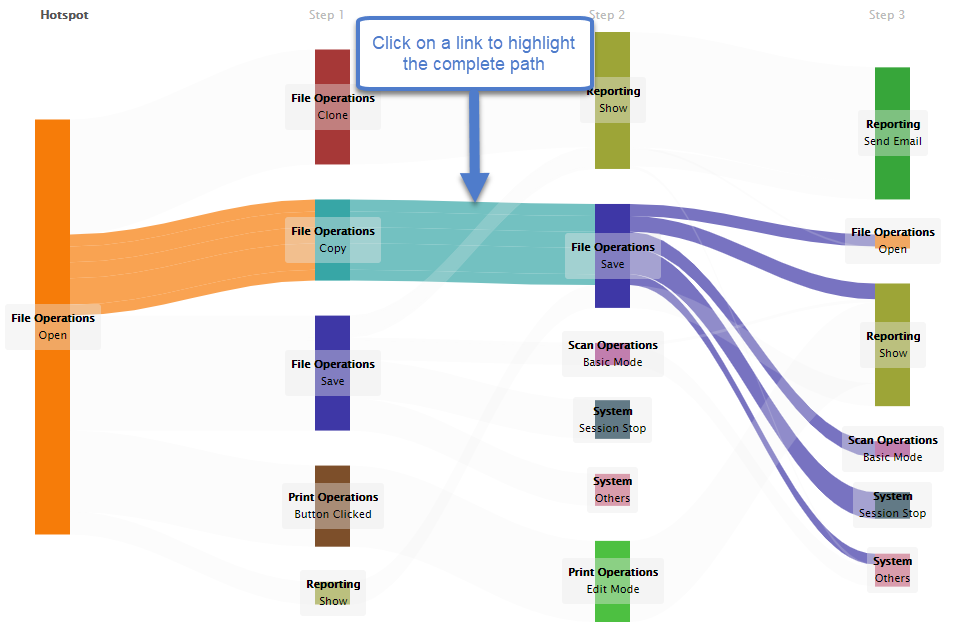
- Clicking on a link will highlight the full paths that are part of that link.
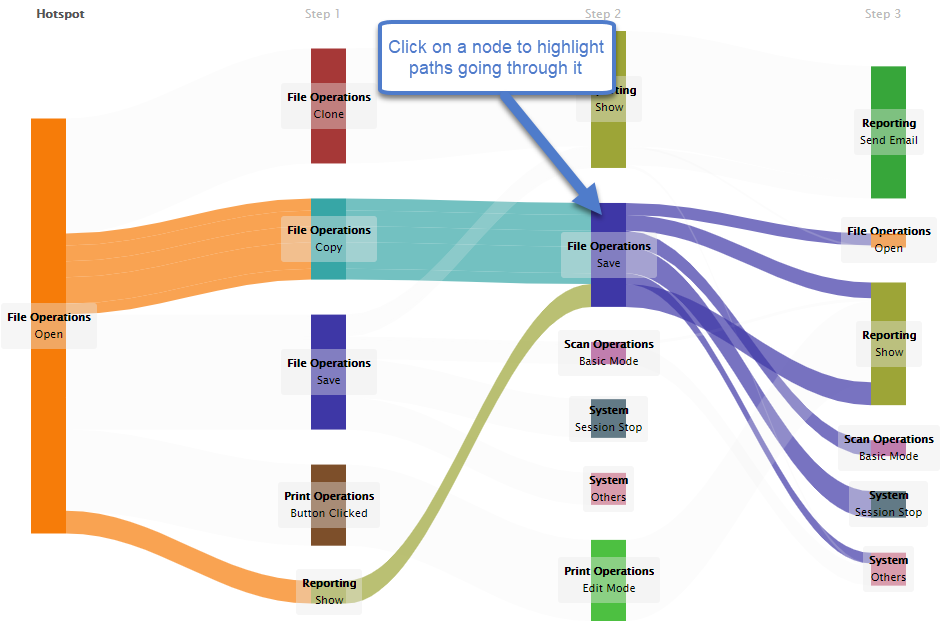
- Clicking on a node will highlight all the paths that pass through that node.
Export Options
You have several export options.
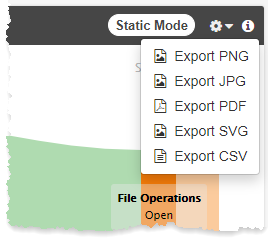
The following are the export options:
- Image : The chart can be saved as an image. The supported formats are PNG, JPG, PDF and SVG.
- CSV: The chart data can be exported to CSV for analyzing offline. When in Interactive Mode you can also export data for a specific path by right clicking on a node and from the options select Export highlighted paths. See The User Flow CSV Export Explained for more information on the CSV export.
Filters
The User Flow report contains fully fledged filtering capabilities including all product, licensing, operating system and environment properties, product usage and ReachOut campaign delivery filtering. This allows you to analyze the usage patterns for specific product editions and versions, compare usage of different cohorts, or measure the effect of ReachOut campaigns.
NOTE: Events are included in the User Flow report once the user session they were generated in has ended. A session ends when the Usage Intelligence function ruiStopSDK() or ruiStopSession() is called. If a session is not closed properly it is considered as timed out after 7 days and will only then be included in the User Flow report.
NOTE: Event paths are processed in batches and can take between 1 - 4 hours to show in the User Flow report.
