
- Flexera Community
- :
- FlexNet Manager
- :
- FlexNet Manager Forum
- :
- Re: Cognos Analytics - Inventory Module
- Subscribe to RSS Feed
- Mark Topic as New
- Mark Topic as Read
- Float this Topic for Current User
- Subscribe
- Mute
- Printer Friendly Page
- Mark as New
- Subscribe
- Mute
- Subscribe to RSS Feed
- Permalink
- Report Inappropriate Content
- Mark as New
- Subscribe
- Mute
- Subscribe to RSS Feed
- Permalink
- Report Inappropriate Content
We have customer requirement to create custom Dashboard on Cognos from Inventory devices, but when select data source "FlexNet Manager Platform Reports and Dashboard", unable to find Inventory Module on that.
If we need to create some report based on Inventory data then how can we get that ?
How can we use Inventory Module in default model? Is there any way to import it ?
Aug 30, 2019 06:29 AM
- Mark as New
- Subscribe
- Mute
- Subscribe to RSS Feed
- Permalink
- Report Inappropriate Content
- Mark as New
- Subscribe
- Mute
- Subscribe to RSS Feed
- Permalink
- Report Inappropriate Content
Hi,
Yes – the data modelling of those fields (#cores etc) (at best) is inconsistent, but in reality is just wrong. If you right click on one that has the hash/pound symbol and choose “Properties” you’ll see that “Usage=Attribute”, whereas the Properties of the one with the L shaped ruler shows “Usage=Measure”. You’ll also note that the Aggregate function in the properties is Count/Total respectively. What that means is when you are just displaying the values of the records at the lowest level (i.e. individual/unique machine) then the correct Core count will be shown, but if you are rendering a widget that is aggregating the records then you will get inconsistent behavior between the two.
I’d suggest you submit a support case to Flexera to register the issue, but in the short term you may still be able to achieve what you need by using a Calculated field. For example, if you :
- right click the “No. of Cores” field under the VM Host object and select “Create calculation”
- select “Use calculation editor”
- change the expression to be (just remove the + 😞
[FNMPS-DW-DS][VM Host].[No of Cores] - Change the Name of the calculated field to something like “VMHostCoreCount”
- Click OK.
You should then have a new field at the bottom of all of the data objects which you can set the Properties to be:
- Usage: Measure
- Aggregate: Total
Hopefully if you then use the VMHostCoreCount it will aggregate as you want.
If I have misunderstood what you’re trying to achieve feel free to send me a private message with details and I’d be happy to see if I can produce the output you are looking for.
-Murray
Oct 18, 2019 08:11 AM
- Mark as New
- Subscribe
- Mute
- Subscribe to RSS Feed
- Permalink
- Report Inappropriate Content
- Mark as New
- Subscribe
- Mute
- Subscribe to RSS Feed
- Permalink
- Report Inappropriate Content
Hello,
Is this for FlexNet Manager Cloud Edition or on premise, please?
Flexera Analytics ships with a data model that currently does not support all objects, but if you post your requirements here we might be able to suggest a solution as many things are possible.
Best regards
Thorsten
(Anything expressed here is my own view and not necessarily that of my employer, Flexera)
Aug 30, 2019 06:53 AM
- Mark as New
- Subscribe
- Mute
- Subscribe to RSS Feed
- Permalink
- Report Inappropriate Content
- Mark as New
- Subscribe
- Mute
- Subscribe to RSS Feed
- Permalink
- Report Inappropriate Content
We need Inventory tab in cognos "FlexNet Manager Platform Reports and Dashboard" module based on that we will create our own Dashboard\report as per requirement.
Aug 30, 2019 08:23 AM
- Mark as New
- Subscribe
- Mute
- Subscribe to RSS Feed
- Permalink
- Report Inappropriate Content
- Mark as New
- Subscribe
- Mute
- Subscribe to RSS Feed
- Permalink
- Report Inappropriate Content
In the data model you refer to (FlexNet Manager Platform Reports and Dashboard), the “Computer” subject would be the one to use if the focus is on hardware inventory, but if you are wanting to report on software then the “Installation” subject might be appropriate. Note that these parts of the data model operate at the individual record level, i.e. an individual computer or an individual install of an application on a computer so if the report (or dashboard) you are trying to build is more of an aggregated count you can still use these objects but there will be more work done at runtime to aggregate the data.


The areas under OLAP are pre-aggregated counts of licenses (measured by consumption/entitlements) or software installations across enterprise groups over time – but note that since these are historical counts you must handle the different snapshots to focus either on a trend or maybe the most current snapshot which should reflect the counts as of the last data warehouse export.

Murray
Sep 01, 2019 07:13 PM
- Mark as New
- Subscribe
- Mute
- Subscribe to RSS Feed
- Permalink
- Report Inappropriate Content
- Mark as New
- Subscribe
- Mute
- Subscribe to RSS Feed
- Permalink
- Report Inappropriate Content
As specific, we need below fields from All Inventory source .
e.g. OS Name, Host details, Core details, Processor, Device Type also required some more fields which is required in All Inventory.
Your prompt response will be appreciate.
Sep 04, 2019 04:29 AM
- Mark as New
- Subscribe
- Mute
- Subscribe to RSS Feed
- Permalink
- Report Inappropriate Content
- Mark as New
- Subscribe
- Mute
- Subscribe to RSS Feed
- Permalink
- Report Inappropriate Content
This is currently not supported by the Analytics data model, but you can pull that data from the management views in the regular UI.
Best regards
Thorsten
(Anything expressed here is my own view and not necessarily that of my employer, Flexera)
Sep 04, 2019 04:32 AM
- Mark as New
- Subscribe
- Mute
- Subscribe to RSS Feed
- Permalink
- Report Inappropriate Content
- Mark as New
- Subscribe
- Mute
- Subscribe to RSS Feed
- Permalink
- Report Inappropriate Content
Sep 04, 2019 04:42 AM
- Mark as New
- Subscribe
- Mute
- Subscribe to RSS Feed
- Permalink
- Report Inappropriate Content
- Mark as New
- Subscribe
- Mute
- Subscribe to RSS Feed
- Permalink
- Report Inappropriate Content
You basically configure your layout (add/remove fields etc.), filter to the required data set and then export as CSV or in any other of the available formats. A management view is any table view you access from the "Management" area of the UI. You can also save these views to the Management View Index for future easy access.
If you have an on premise version of FlexNet Manager you can also query the database and collect data this way.
Best regards
Thorsten
(Anything expressed here is my own view and not necessarily that of my employer, Flexera)
Sep 04, 2019 04:48 AM
- Mark as New
- Subscribe
- Mute
- Subscribe to RSS Feed
- Permalink
- Report Inappropriate Content
- Mark as New
- Subscribe
- Mute
- Subscribe to RSS Feed
- Permalink
- Report Inappropriate Content
Hi,
OS Name, Core Counts, Processor Type, Device Type, Host Details (host name, manufacturer, model, ip address and basically all other fields available in the UI - even custom fields) are all available via the Computer subject in the data model "FlexNet Manager Platform Reports and Dashboard", so I would be confident that based on what you have described so far a report could be developed that captures the data you want in either a graphical/chart view or text/tabular/grid based.
Maybe it would be better if you describe the specific things that you think you *cannot* access using Analytics then I could confirm either way if it is achievable.
Otherwise, if you'd be willing to describe the layout of the visualisation/report/dashboard you are aiming for (even if it's drawn on paper & copied) I could take a stab at mocking something up.
- Murray
Sep 04, 2019 08:45 AM
- Mark as New
- Subscribe
- Mute
- Subscribe to RSS Feed
- Permalink
- Report Inappropriate Content
- Mark as New
- Subscribe
- Mute
- Subscribe to RSS Feed
- Permalink
- Report Inappropriate Content
When we select core from Computer-> Computer -> #No of Cores, that count is not matched with All Inventory->Cores Count.
In Computer Module, it shows count of servers instead of sum of cores.
Will you please join webex for 15-20 mins for said issue ?
Sep 05, 2019 02:29 AM
- Mark as New
- Subscribe
- Mute
- Subscribe to RSS Feed
- Permalink
- Report Inappropriate Content
- Mark as New
- Subscribe
- Mute
- Subscribe to RSS Feed
- Permalink
- Report Inappropriate Content
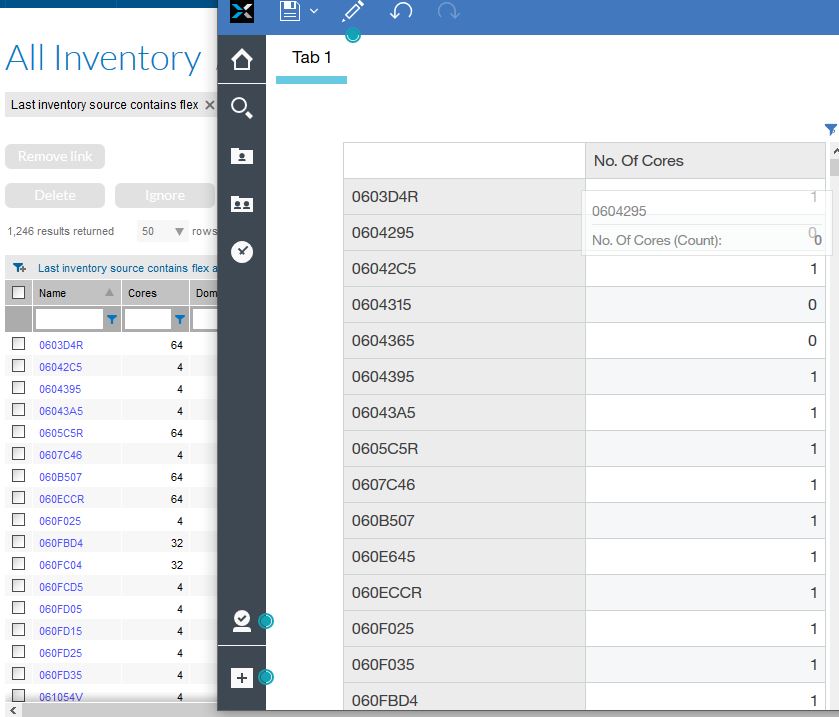
Hi - I'm not seeing any discrepancies between that core counts shown in Cognos versus FNMS - see below as an example of what I am seeing:

Could you share examples of what you are seeing?
-Murray
Sep 05, 2019 03:35 AM
- Mark as New
- Subscribe
- Mute
- Subscribe to RSS Feed
- Permalink
- Report Inappropriate Content
- Mark as New
- Subscribe
- Mute
- Subscribe to RSS Feed
- Permalink
- Report Inappropriate Content
- Mark as New
- Subscribe
- Mute
- Subscribe to RSS Feed
- Permalink
- Report Inappropriate Content
- Mark as New
- Subscribe
- Mute
- Subscribe to RSS Feed
- Permalink
- Report Inappropriate Content
OK thanks for uploading the screenshot. I can see that you are using the dashboard editor (I was using the report studio) so that makes more sense. The data model "FlexNet Manager Platform Reports and Dashboard" existed prior to IBM/Cognos releasing the new dashboard tools - without getting too technical it was CQM (Compatible Query Mode) based and was really intended more for Reports. Data models used for dashboarding are DQM (Dynamic Query Mode) based which enables Cognos to generate queries better for the dynamic nature of the dashboards. In your simple layout of 1 widget/2 fields it renders ok, but I would expect that you'd start running into issues when you have multiple widgets on the page and they start filtering each other.
So, my suggestion would be to use the "Flexera Data Models" for Dashboarding and use "FlexNet Manager Platform Reports and Dashboard" for creating Reports.
Having said that, if you want to make what you've done show the SUM of cores instead of the COUNT of VM's that have a core count you can "Edit" the widget and go to the "Summarize" options for No. Of Cores. Here you will see the options for aggregating the measure - the default will be what is released in the data model but you can override that if/as needed (eg change Count to Sum as highlighted below).

Note though, that if you are aiming to list the No of Cores in the host then using this combination will not be accurate as it assumes the #Cores in the host is just the sum of all the cores in the VM's hosted by it. This can be wrong for several reasons (eg not all VM's have returned inventory, or virtual pools are used to share cores across vm's etc).
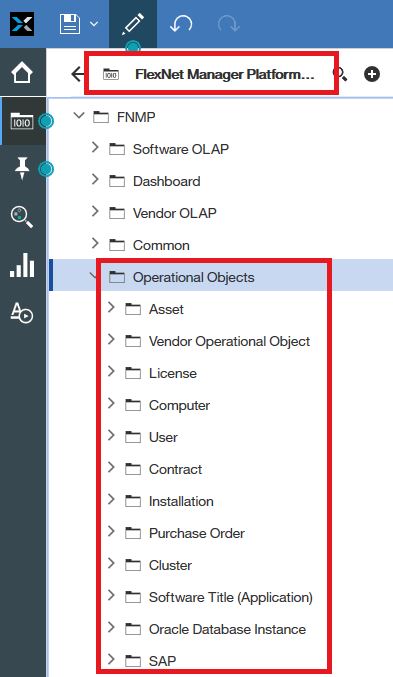
If however you choose the following combination you should get the actual core count as a single figure for the computer/host:
Operational Objects/Computer/Computer-General/Computer Name
Operational Objects/Computer/Computer-Extended/No. Of Cores
- Murray
Sep 05, 2019 05:12 PM - edited Sep 05, 2019 11:46 PM
- Mark as New
- Subscribe
- Mute
- Subscribe to RSS Feed
- Permalink
- Report Inappropriate Content
- Mark as New
- Subscribe
- Mute
- Subscribe to RSS Feed
- Permalink
- Report Inappropriate Content
We have prepared report as per our requirement ad got correct core details for Virtual Machine.
But when preparing same report for Computers and VM Host core count is not matching with Inventory count. Then found that If we select No. of core details of Virtual Machine then it showing different symbol.


Due to this reason core counts showing as a number instead of SUM.
Oct 17, 2019 11:42 PM
- Mark as New
- Subscribe
- Mute
- Subscribe to RSS Feed
- Permalink
- Report Inappropriate Content
- Mark as New
- Subscribe
- Mute
- Subscribe to RSS Feed
- Permalink
- Report Inappropriate Content
Hi,
Yes – the data modelling of those fields (#cores etc) (at best) is inconsistent, but in reality is just wrong. If you right click on one that has the hash/pound symbol and choose “Properties” you’ll see that “Usage=Attribute”, whereas the Properties of the one with the L shaped ruler shows “Usage=Measure”. You’ll also note that the Aggregate function in the properties is Count/Total respectively. What that means is when you are just displaying the values of the records at the lowest level (i.e. individual/unique machine) then the correct Core count will be shown, but if you are rendering a widget that is aggregating the records then you will get inconsistent behavior between the two.
I’d suggest you submit a support case to Flexera to register the issue, but in the short term you may still be able to achieve what you need by using a Calculated field. For example, if you :
- right click the “No. of Cores” field under the VM Host object and select “Create calculation”
- select “Use calculation editor”
- change the expression to be (just remove the + 😞
[FNMPS-DW-DS][VM Host].[No of Cores] - Change the Name of the calculated field to something like “VMHostCoreCount”
- Click OK.
You should then have a new field at the bottom of all of the data objects which you can set the Properties to be:
- Usage: Measure
- Aggregate: Total
Hopefully if you then use the VMHostCoreCount it will aggregate as you want.
If I have misunderstood what you’re trying to achieve feel free to send me a private message with details and I’d be happy to see if I can produce the output you are looking for.
-Murray
Oct 18, 2019 08:11 AM
- Mark as New
- Subscribe
- Mute
- Subscribe to RSS Feed
- Permalink
- Report Inappropriate Content
- Mark as New
- Subscribe
- Mute
- Subscribe to RSS Feed
- Permalink
- Report Inappropriate Content
Oct 22, 2019 02:48 AM
- Mark as New
- Subscribe
- Mute
- Subscribe to RSS Feed
- Permalink
- Report Inappropriate Content
- Mark as New
- Subscribe
- Mute
- Subscribe to RSS Feed
- Permalink
- Report Inappropriate Content
Hi @MurrayPeters , I saw your post on this.
We're currently on FNMS Cloud and wondering if could show me how to create a new calculations as an example on Total # of Devices/Computer or Total # of Operating Systems, etc.. in FlenxNet Manager Platform Reports and Dashboard -> FNMP -> Operation Objects -> Computer -> Computer-General or anywhere
thanks,
Chris
Jun 26, 2020 02:11 PM
- Mark as New
- Subscribe
- Mute
- Subscribe to RSS Feed
- Permalink
- Report Inappropriate Content
- Mark as New
- Subscribe
- Mute
- Subscribe to RSS Feed
- Permalink
- Report Inappropriate Content
A suite of Inventory Management reports are included in the Maximo BI Packs MyLowesLife.
Sep 04, 2019 05:02 AM
- FlexNet Manager Suite On-Premises 2024 R1 in FlexNet Manager Release Blog
- Enabling Webdav in analytics server. in FlexNet Manager Forum
- AWS - Test connection failure - Error unmarshalling back from AWS in FlexNet Manager Forum
- FlexNet Manager Suite On-Premises 2023 R1 in FlexNet Manager Release Blog
- Create reports/charts from SQL query in Cognos Analytics in FlexNet Manager Forum
