- Flexera Community
- :
- FlexNet Manager
- :
- FlexNet Manager Blog
- :
- Analytics dashboard enhancements - June 2020
- Subscribe to RSS Feed
- Mark as New
- Mark as Read
- Subscribe
- Printer Friendly Page
- Report Inappropriate Content
- Subscribe to RSS Feed
- Mark as New
- Mark as Read
- Subscribe
- Printer Friendly Page
- Report Inappropriate Content
As part of FlexNet Manager Suite 2020 R1 we are delivering an expanded set of Analytics dashboards and insights. We developed these visualizations in collaboration with several customers and partners, who provided ideas and feedback to ensure that we deliver visualizations that provide out –of-the-box value.
Availability:
On-premises customers will be able to download and install the new dashboard and widget content from Product and License Center, without the requirement to upgrade to the 2020 R1 release.
Cloud customers can access the dashboards in their Cloud instances starting June 16th, 2020.
The dashboards can be viewed in FlexNet Manager Analytics. If you are unsure how to access FlexNet Manager Analytics, please review Accessing FlexNet Manager Analytics post.
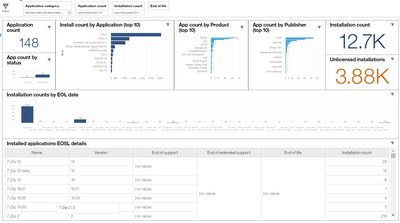
Application Rationalization dashboard
This dashboard delivers a collection of visualizations that provide information about applications in your environment that you may want to remove, update, or consolidate. It provides information about application counts, management status, and end of service life (if/where available).
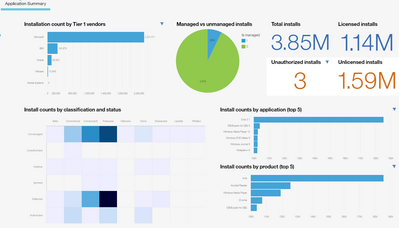
Application Summary dashboard
This dashboard provides a collection of visualizations that provide a high-level summary of top software producers (by install count), top applications (by install count), and distribution of applications based on component classification (e.g. commercial, freeware, etc.) and status (e.g. manager, unauthorized, etc.). Using this view, you can evaluate what software producers and applications you should be focusing on, from the Software Asset Management perspective. You can also identify the types of applications found—for example, do you have any unauthorized (blacklisted) software installations in your environment, so you can take appropriate actions.
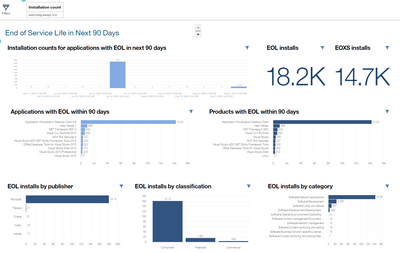
End of Service Life – 90-day window dashboard
If you have end of service life information in FlexNet Manager Suite, this dashboard informs you about software installations for applications and versions that are reaching end of life. This provides important insights, as end-of-life applications may require custom support agreements or may become unsupported, potentially increasing security risk.
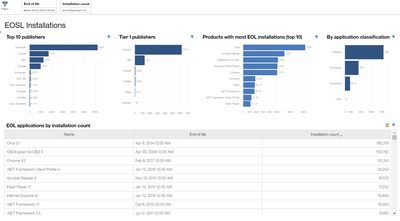
End of Service Life – as-of date dashboard
For a broader view of application lifecycle status (if available), you can use this dashboard. It drives focus to those applications that have the most installations—which may represent the highest potential risk.
Hardware Assets dashboard
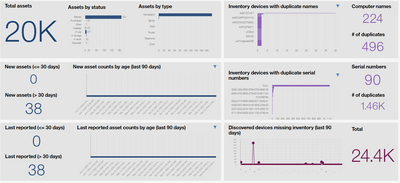
Managing hardware is foundational in IT Asset Management. As a result, understanding changes in hardware assets and inventory is key to identifying anomalies in your environment. Are you missing inventory, and is this expected (after all, devices are retired and disposed over time)? Do you see expected levels of new inventory? Do you see any issues (duplicate names or serial numbers, which can cause inventory matching collisions)?
Operational dashboard
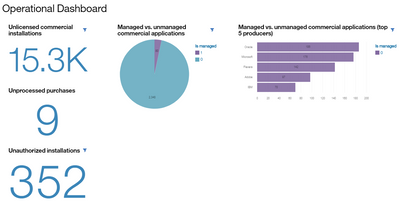
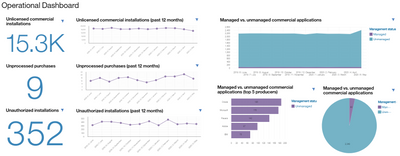
There are two variations of this dashboard
On-premises version:
This dashboard provides information to help you understand where to focus your attention to improve overall health of your managed software environment. Unprocessed purchases suggest there are assets or entitlements that have not yet been entered, impacting the completeness of the system. Understanding unlicensed or unmanaged commercial applications will allow you to focus your work on reducing compliance risk (some of this may be expected if you only manage key software producers and product licenses centrally and departments do their own purchasing for some software).
Cloud version:
In addition to the visualizations in the on-premises version, the Cloud version of the Operational dashboard includes trending data. This shows you the health of your environment over time. You can easily see whether you are improving the management of your environment—providing valuable insights to your team and your management about the effectiveness of your efforts.
Publisher Portfolio Dashboard
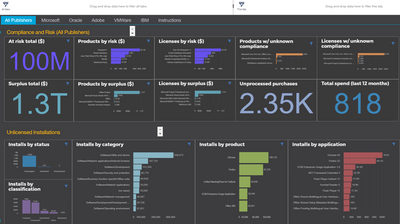
This is a unique dashboard, in that it is six dashboards in one—with each tab providing access to a dashboard filtered to a specific key software producer. The All Publishers tab provides compliance and risk information for all publishers across your environment. (The Instructions tab provides information about adding additional dashboard tabs.)
This dashboard provides information related to:
- Compliance status, potential surplus, and financial risk (based on information input in FlexNet Manager Suite)
- Unlicensed installation information—including breakdowns based on status, classification; and the top products and applications (product versions) found in your environment.
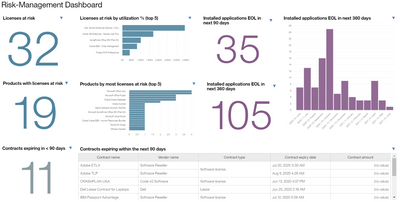
Risk Management dashboard
This dashboard focuses on data that may represent risk in your environment. Whether it’s compliance, high utilization rates, end of life, or expiring contracts, these data points suggest where action may be required to minimize risk to your organization.
If you are looking for instructions on how to access Analytics, please check out a separate post on this topic.
You must be a registered user to add a comment. If you've already registered, sign in. Otherwise, register and sign in.
- Is this possible on FNMS on prim COGNOS IBM Cognos Analytics 11.0.13 (LTS) in FlexNet Manager Forum
- How to view SQL query behind a chart / dashboard in Cognos / Flexera analytics? in FlexNet Manager Forum
- FlexNet Manager Suite On-Premises 2023 R1 in FlexNet Manager Release Blog
- Dashboard Widget Content Blocked Error in FlexNet Manager Forum
- FNMS Analytics Stopped Showing Data After Upgrade in FlexNet Manager Forum
