Snow Commander records system activity in great detail by writing to text logs on the application server. Most often the logs are used for troubleshooting when interacting with Snow Technical Support. An easy way to provide the logs to Snow Technical Support is to run the
Commander diagnostics and share the zipped output by attaching them to a
case you've opened.
By default, the logs are configured to operate at INFO level, which compromises details in the interest of keeping the data logged down to a reasonable amount. Occasionally you change the configuration to log DEBUG information when investigating an issue, as this will provide much deeper insight into what's happening.
Enabling DEBUG Logging
To enable debug logging, edit the appropriate xml file from the list below using a text editor like notepad or notepad++:
| Default File Locations* | Purpose |
|---|
| <Install Directory>\Program Files\Embotics\Commander\tomcat\common\classes\log4j2.xml | General System Logging
|
| <Install Directory>\Program Files\Embotics\Commander\identityservice\config\log4j2.xml | Authentication Service
|
| <Install Directory>\Program Files\Embotics\Commander\currency-service\config\log4j2.xml | Currency Service
|
| <Install Directory>\Program Files\Embotics\Commander\terraform-service\logs\config\log4j2.xml | Terraform Service |
* Older installs may use vCommander as the folder name rather than Commander.
The xml files contain both active loggers that by default record information and inactive loggers which need to be turned on before they will record anything. You can tell which are active because the inactive ones are enclosed inside XML comments.
Example 1 - SAML SSO
By default the logging for SAML SSO is enabled at INFO level:
<!--
    #############
    ## SSO
    #############

<Logger level="TRACE" name="org.springframework.security"/>
<Logger level="TRACE" name="PROTOCOL_MESSAGE"/>
-->
<Logger level="INFO" name="org.springframework.security.saml.log.SAMLDefaultLogger"/>
To update the SAML SSO logging to record information at DEBUG level, you would edit the section this way:
<!--
    #############
    ## SSO
    #############

<Logger level="TRACE" name="org.springframework.security"/>
<Logger level="TRACE" name="PROTOCOL_MESSAGE"/>
-->
<Logger level="DEBUG" name="org.springframework.security.saml.log.SAMLDefaultLogger"/>
Notice that the Logger level has been updated from INFO to DEBUG.
Example 2 - Service Deployments
By default the detailed logging for service deployments is disabled. You can tell because the lines with the
Logger level are enclosed an XML comment:
<!--
    #############
	## Service deployments
    #############

    <Logger level="DEBUG" name="servicedeployments"/>
-->
To enable the logging, edit the file so that the comments no longer enclose the lines with the Logger level defined:
<!--
    #############
	## Service deployments
    #############
   -->
    <Logger level="DEBUG" name="servicedeployments"/>
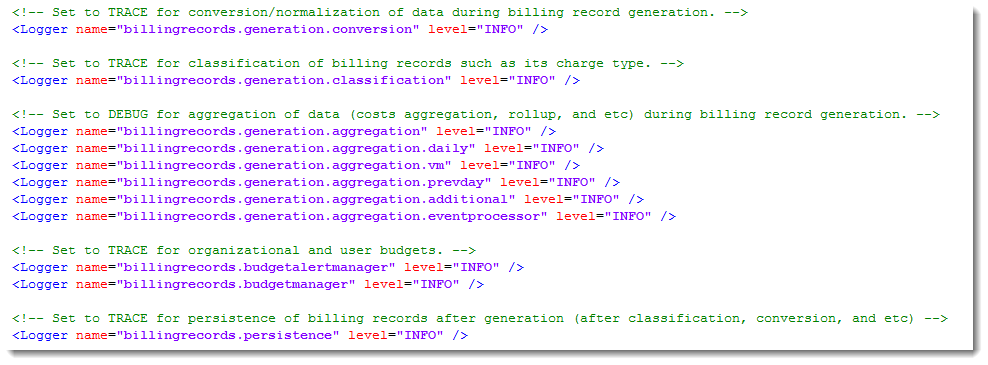
Throughout the file, comments also provide guidance on when it's appropriate to turn up the logging level to DEBUG or TRACE:
Available Loggers
The following loggers may be enabled during the course of an investigation, but are not enabled by default. This is not a comprehensive list, but rather a list of commonly used loggers. Snow Support will typically provide customers with details about which loggers should be enabled during an investigation.
| File | Logger | Investigates |
|---|
| \tomcat\commom\classes\log4j2.xml | <Logger level="DEBUG" name="ruleengine"/> | Rules engine issues.
|
| | <Logger level="DEBUG" name="recommendations"/> | Recommendations issues.
|
| | <Logger level="DEBUG" name="servicerequests"/> | Service request failures.
|
| | <Logger level="DEBUG" name="servicedeployments"/> | Deployment of services and workloads.
|
| | <Logger name="billingrecords.generation" level="TRACE" /> | Generating billing records. |
| | <Logger name="billingrecords.persistence" level="DEBUG" /> | Generating billing records. |
| | <Logger name="billingrecords.uptime" level=" DEBUG"/> | Generating billing records. |
| | <Logger name="servicecost.retrieval " level="DEBUG" /> | Service Costs / Costs Analytics View |
| | <Logger name="servicecost.persistence" level="DEBUG" /> | Service Costs / Costs Analytics View |
| | <Logger name=" servicecost.aggregator " level="DEBUG" /> | Service Costs / Costs Analytics View |
| | <Logger name=" servicecost.eventprocessor " level="DEBUG" /> | Service Costs / Costs Analytics View |
| | <Logger name=" servicecost.budgetalertmanager " level="DEBUG" /> | Service Costs / Costs Analytics View |
| | <Logger name=" servicecost.budgetmanager" level="DEBUG" /> | Service Costs / Costs Analytics View |
| | <Logger name="com.embotics.vlm.service.network" level="DEBUG"/> | IP pools |
| | <Logger name="MethodTiming" level="DEBUG"/> | Method Timing |
| | <Logger name="workflow" level="DEBUG"/> | Issues with workflow processing. |
| | <Logger name="workflow.RemoteCommandRunner" level="DEBUG"/> | Issues with guest OS steps in workflow processing. This is automatically included in workflow debugger, so only use when investigating Guest OS Steps without the rest of the workflow noise. |
| | <Logger level="DEBUG" name="com.embotics.vlm.service.task"/> | Issues with workflow processing. |
| | <Logger level="DEBUG" name="com.embotics.vlm.expiryextension.servlet.WorkflowActionServlet"/> | Issues with Workflow email links (approval, Quota, Acknowledgement). |
| | <Logger level="DEBUG" name="com.embotics.vlm.ui.servlet.LoginServlet"/> | Login Handling & redirection |
| | <Logger level="DEBUG" name="com.embotics.portal.security.LoginBean"/> | Login Handling & redirection |
| \identityservice\config\log4j2.xml | <Logger name="embotics.identityservice.service.security.userdirectory" level="DEBUG"/> | Active Directory or LDAP. |
| | <Logger name="AccountManager.Persister" level="DEBUG"/> | Active Directory or LDAP. |
| | <Logger name="identityservice" level="DEBUG"/> | Active Directory or LDAP. |
| \terraform-service\config\log4j2.xml | <Logger level="DEBUG" name="mediator.azure"/>
<Logger level="DEBUG" name="mediator.terraform-cloud"/>
<Logger level="DEBUG" name="mediator.aws"/> | Terraform connections or synch issues backed by named resource. |
| | <Logger level="DEBUG" name="service.account"/> | Terraform connections or synch issues. |
| | <Logger level="DEBUG" name="validator.account"/> | Terraform connections or synch issues. |
| | <Logger level="DEBUG" name="rest.converter"/> | Terraform connections or synch issues. |
Redirect Logs
In the event that you need split off a logger to its own file to make the logs easier to read, follow the process below.
- Open the appropriate log4j2.xml file and locate the section enclosed between the <Appenders> ... </Appenders>.
- Add the following content between the Appender tags to define the new filename to which logging will be redirected. In the example below, the logging for is being sent to a file named billing_records.log. Use a meaningful name value, as you will be creating references for each logger using this name to redirect logs to the defined filename.
<RollingFile fileName="${sys:catalina.home}/logs/billing_records.log" filePattern="${sys:catalina.home}/logs/billing_records-%i.log" ignoreExceptions="false" name="billingrecords">
  <PatternLayout>
    <Pattern>%d [%t] [%-5p] %c{3} - %m%n</Pattern>
  </PatternLayout>
  <Policies>
    <SizeBasedTriggeringPolicy size="10 MB"/>
  </Policies>
  <DefaultRolloverStrategy fileIndex="min" max="1000"/>
</RollingFile>
- For each logger you want to capture in the named file, update the logger from:
<Logger level="INFO" name=billingrecords.generation" />
to
<Logger additivity="false" level="DEBUG" name=billingrecords.generation">
  <Appender-Ref ref="billingrecords" />
</Logger>
Note that you do not necessarily need to change the level to DEBUG, but generally this is a good idea. Most of the time splitting off to a new log file is being done to capture debug information separately from the regular log noise.
See Also